
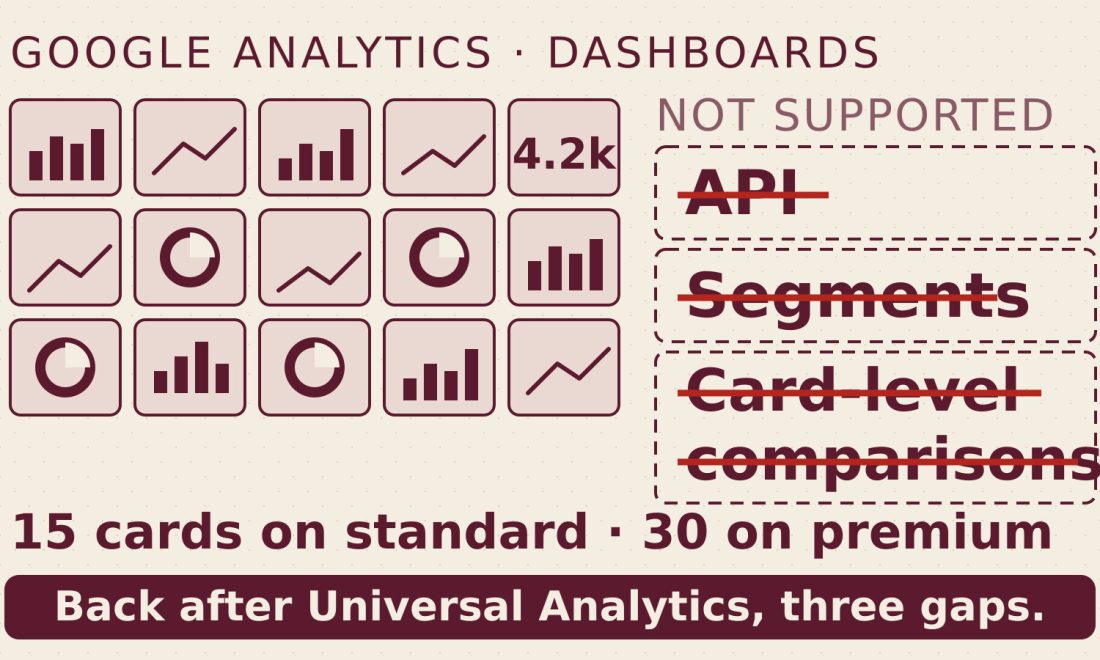
Google Analytics added dashboards on September 9, according to the “What’s new” entry dated that day. The help page “About Google Analytics dashboard,” which carries no date, describes a drag-and-drop grid canvas with six visualization types that publishes straight into the Reports left navigation, sets a per-dashboard ceiling of 15 cards on standard properties and 30 on what it calls “premium properties,” and restricts creation and publishing to the Editor and Administrator roles. It also names three things as not supported: API support, segments, and card-level comparisons.
How Many Cards Can a Google Analytics Dashboard Have?
A Google Analytics dashboard holds up to 15 cards on standard properties and up to 30 on premium properties, per the help page. Only users with the Editor or Administrator role can create or publish one, though anyone with property access can view one already published. The help page lists API support, segments, and card-level comparisons as “currently not supported.”
What Universal Analytics Dashboards Used to Hold
Universal Analytics counted its dashboards in widgets, not cards, and the ceiling sat lower. The legacy help page “Limitations of Dashboards” put the cap at 12 widgets per dashboard, with room for 20 private dashboards per user in each view and 50 shared dashboards per view; sharing a dashboard required the Editor role. Those dashboards went dark in two stages, per Google’s Universal Analytics sunset page: standard properties stopped processing hits on July 1, 2023, and most users lost access to the interface and the API the week of July 1, 2024.
The help page calls the higher card tier “premium properties,” not “Google Analytics 360,” the name that Google’s separate configuration-limits page gives the upgrade that carries higher limits. Whether the two terms cover the same properties is not stated.
| Universal Analytics dashboards | Google Analytics dashboards now | |
|---|---|---|
| Per-board cap | 12 widgets | 15 cards standard, 30 premium |
| Number of boards | 20 private per user per view, 50 shared per view | Not stated |
| Sharing | Private by default; Editor role to share | “All published dashboards are shared with the property” |
| Who builds it | Not stated; Editor role to share | Editor or Administrator to create and publish |
| Named unsupported items | Linked reports limited to first two metric columns | API support, segments, card-level comparisons |
One Editor’s Publish Click Lands in Everyone’s Left Navigation
Building a dashboard starts in Reports: click “+ Create” in the left navigation, choose Dashboard, then drag chart types onto a grid canvas and drop dimensions and metrics onto each one, per the help page’s own walkthrough. Six visualization types are available: score cards, table charts with shaded bars and pagination, line charts for daily, weekly, or monthly trends, bar charts, donut charts, and funnel charts for conversion steps and drop-off points.
Publishing changes who sees the result. The help page states that “all published dashboards are shared with the property,” and an Editor or Administrator who clicks Publish adds the dashboard to the Reports left navigation for every user with property access, not a chosen list of viewers. Anyone with access to the property can view a published dashboard; the help page reserves creating and publishing for the Editor and Administrator roles.
Two Lines on Comparisons That Don’t Quite Meet
The help page makes two separate statements about comparisons and does not connect them. On score cards: “High-level KPIs that can include percentage changes when date comparisons are applied.” On the launch’s limits: “API support, segments, and card-level comparisons are currently not supported.” Read together: a score card can show a percentage change, but card-level comparisons are absent from the same release, and the page does not explain how the two fit together.
Two Dashboard Announcements: The September Pages Don’t Say Whether They Match
Google’s blog had already used the word Dashboards for Analytics before September. On August 10 it announced new Dashboards in Google Ads, “coming soon in Google Analytics,” built from “simple text prompts,” with each report paired to an automatically generated summary. The September 9 entry and the “About Google Analytics dashboard” help page describe a drag-and-drop grid canvas, and neither mentions prompts, Gemini, or artificial intelligence. Whether the canvas that shipped is the feature promised in August is not something either page says.
What to Check Before Promising a Client a Dashboard
The role gate is worth confirming first: anyone without the Editor or Administrator role can open a published dashboard but cannot build or publish one, so adding a dashboard to shared reporting is an Editor- or Administrator-level request. Because publishing shares the result with the whole property, not a chosen list, the left-navigation slot should be treated as public within that property, not personal.
The missing pieces set the ceiling on what a dashboard can replace. Segments are one of the three items the help page names as not supported; API support is another. That leaves a role-gated page inside Google Analytics, the product whose standard reports showed zero traffic for September 1 while Realtime kept counting.
The absence list is also the story, in the same way it was the story in Merchant Center’s AI performance insights report, where the instructions outran the data behind them. A report is only as useful as what it’s allowed to show, and here it’s Google’s own help page naming what this one can’t: no API, no segments, no card-level comparisons, and, on the page that announced it, no word on whether it’s the feature promised in August.
Sources: Google Analytics Help, “About Google Analytics dashboard”; Google Analytics Help, “What’s new in Google Analytics”.